
Open the model
Worked example: Brăila
Brăila sits on the left bank of the Danube in south-east Romania - a city of about 154,686 residents (roughly 172,000-180,000 across the wider county service zone). Much of it lies low, right by the river, and so does its wastewater plant, SEAU Brăila, on the north-eastern edge. A single combined sewer carries foul and storm water; because the ground is flat and low, the dry-weather flow cannot reach the plant by gravity - it has to be pumped, station after station, up to treatment.
This example asks a question none of the others do. Not is the model right (Warkworth) or what does it cost (Bello) or how do we relieve flooding (Buzet), but: once everything is pumped, how do we make the treatment plant’s life easier? A plant hates a flow that swings up and down - its primary, secondary and tertiary stages all run best on a steady inflow. The answer here is automated real-time control (RTC).
Download the file
What is in the model
Section titled “What is in the model”| Network | ~1,900 junctions, ~1,900 subcatchments - about two thirds of the city |
| System | combined foul + storm, SI (LPS); all sanitary flow pumped to the plant |
| Pumping | 7 lift stations, 13 pumps lifting the low Danube-side flow up to the WWTP |
| Relief | one CSO (CSO1) that spills only in storms; the plant outfall is O1 |
| Plant | SEAU Brăila - designed for 266,667 PE, ~95,040 m³/day dry-weather flow (built for the city’s growth) |
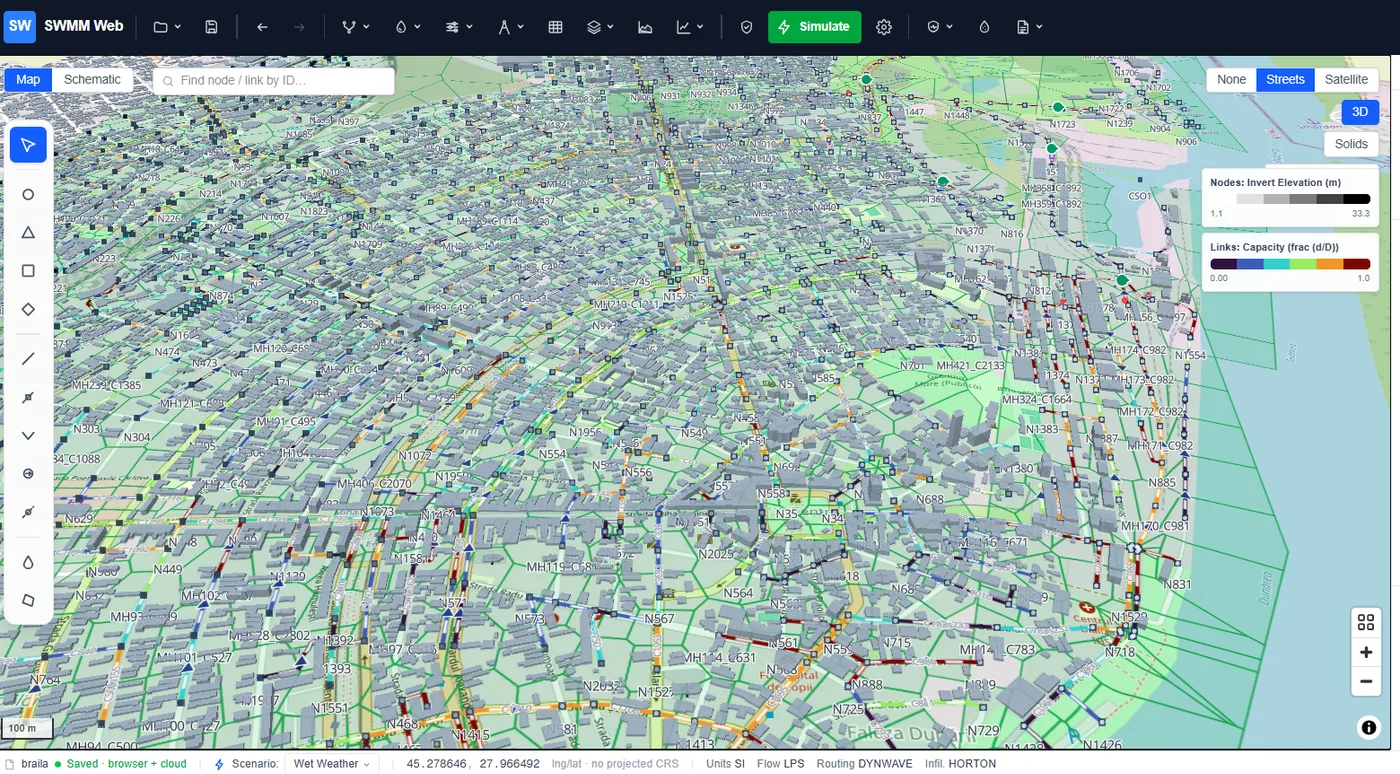
| Built from | open map data, incl. 18,589 building footprints; viewable in 3D |
1. The system: everything is pumped, and in dry weather it all reaches the plant
Section titled “1. The system: everything is pumped, and in dry weather it all reaches the plant”Run the model (the green Simulate button). In dry weather the network is clean:
- zero flooding, and
- the CSO spills nothing - every drop of foul flow is pumped to SEAU Brăila, not to the river.
That is the correct behaviour for a combined system: the CSO is for storms, and in dry weather the seven lift stations carry the whole sanitary load to treatment.
2. The problem the plant actually sees: a violently peaky inflow
Section titled “2. The problem the plant actually sees: a violently peaky inflow”Now look at what arrives at the plant. Colour the map by inflow, or plot the flow into O1 with Graph ▸ Quick graph. The dry-weather inflow to the WWTP is not the smooth daily curve you might expect - it is violent:
| Dry-weather WWTP inflow | Peak | Average | Peak / average | Minimum |
|---|---|---|---|---|
| the pumps as delivered | 674 LPS | 207 LPS | 3.26 | 0 LPS |
The pumps switch fully on and fully off on their wet-well levels, so the plant is hit with a train of pulses - swinging between 0 and 674 LPS several times an hour. The average is only ~207 LPS, but the plant has to cope with peaks over three times that, and with the flow dropping to nothing in between. For the biological stages of treatment, that is exactly the wrong thing.
3. The fix: automated RTC flow-equalisation
Section titled “3. The fix: automated RTC flow-equalisation”This is a control problem, not a capacity one - the pumps and wet wells already exist; they just act crudely. SWMM Web’s control rules turn the fixed-speed, bang-bang pumps into variable-speed ones: each duty pump throttles its speed to its wet-well level (35 rules across the seven stations), so the combined output tracks the incoming flow rather than chasing it in pulses. The wet wells become small buffers, and the plant sees a flat line.
| Dry-weather WWTP inflow | Peak | Average | Peak / average | Minimum |
|---|---|---|---|---|
| baseline (bang-bang) | 674 LPS | 207 LPS | 3.26 | 0 LPS |
| with RTC (modulated) | 363 LPS | 213 LPS | 1.71 | 18 LPS |
- Peak inflow cut 46 % (674 → 363 LPS),
- peak-to-average nearly halved (3.26 → 1.71),
- the minimum rises from 0 to 18 LPS - no more flow starvation between pulses,
- and the same total volume still reaches the plant (average essentially unchanged).
4. Wet weather: the storm is handled, and that is enough
Section titled “4. Wet weather: the storm is handled, and that is enough”Switch to the 2-year design storm. The network takes it with minor deficiencies - about 11 nodes surcharge and the CSO does its job, spilling the storm surplus to the river so the sewer is relieved. The goal here is deliberately not to eliminate every flood (that would mean rebuilding a two-thirds-of-a-city combined system); it is to keep the storm manageable while protecting the plant. As a bonus, the smoother RTC pumping even reduces the wet-weather flooding (about 163 → 127 ML) - a steadier system copes better with the surge.
5. Seeing it: 18,589 buildings and full 3D
Section titled “5. Seeing it: 18,589 buildings and full 3D”Brăila was built from open map data, including 18,589 building footprints, and the whole network - pipes, manholes, wet wells and buildings - can be explored in 3D. It turns an abstract sewer model into something a city engineer recognises: the streets, the blocks, the river.
What this example does not show
Section titled “What this example does not show”- A survey-grade network. It is built from open map data (geo-to-model) over ~2/3 of the city - a realistic system to reason about, not an as-built utility record. Inverts, pump sizes and station locations are estimated.
- A calibrated plant model. The RTC result is a relative improvement on this model’s own baseline; a real scheme would tune the rules against SCADA and the plant’s actual hydraulic and process limits.
- A finished storm design. The wet-weather flooding is left in on purpose - the point is the dry-weather equalisation and the CSO behaviour, not a full storm-relief scheme.
- Optimised control. These are sensible heuristic rules (speed vs level); the next step is to optimise the thresholds against a flow-variability objective.
- Worked example: Buzet - the operational digital twin (forecast / alerts / regulator report)
- Worked example: Bello - pump energy and off-peak scheduling on a real city network
- Control rules - write your own real-time control
- Reading results - the thematic map, profiles and time series