
The interface
Four regions. Learn these and everything else is discoverable.
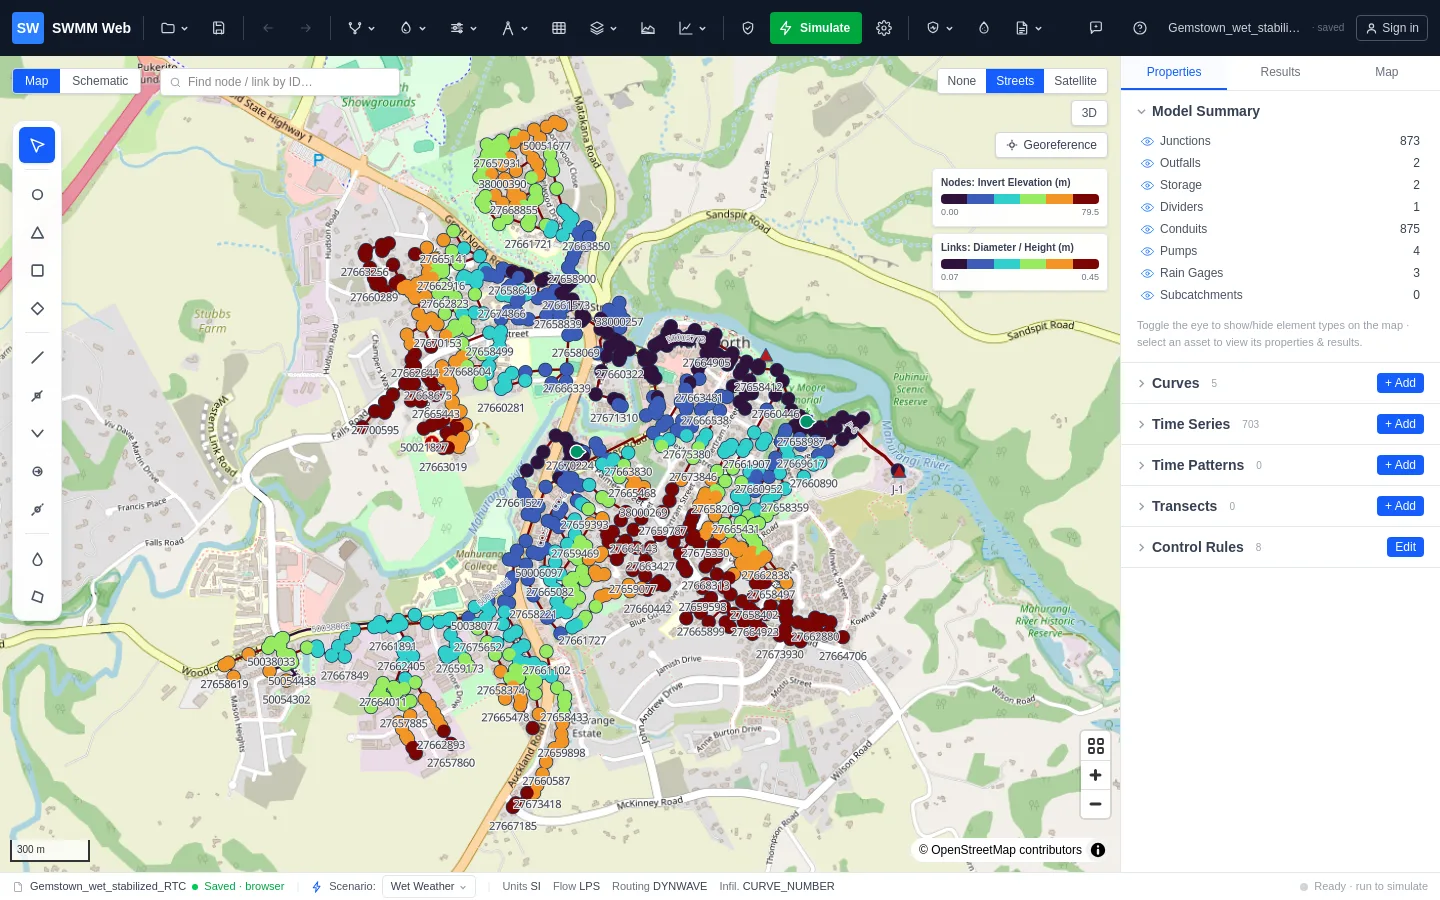
Toolbar
Section titled “Toolbar”The top strip, organised into groups rather than one long row of icons:
| Group | Contains |
|---|---|
| Project | New, open, save and export models, building a model from GIS or from a location, My projects |
| Save · Undo · Redo | Quick save of the project, and undo/redo of model edits |
| Trace network | Upstream and downstream traces, quality checks, topology repair, data completeness, network statistics |
| Interact with the water network | The EPANET water model, and the demand that becomes sewer dry-weather flow |
| Model data | Patterns, curves, rainfall, transects, elevations, delineation, monitoring data, calibration, LID, groundwater, control rules, scenarios |
| Design tools | Open channel, culvert and pond tools |
| Flex Tables · Thematic map styling · Profile · Graph | The ways of looking at the network and its results |
| Validate · Simulate · Calculation options | Check the model, run it, and set up the run |
| Resilience & adaptation | Design storms and climate, scenario comparison, level of service, continuous simulation, upsizing, detention, RTC, flood risk, asset risk |
| Water Quality | Pollutants, loads and pollutographs |
| Operations & reports | Interactive report, water balance, spill register, CSO forecast and alerts, Live Ops, outages, blockages, development capacity |
| BIM workflow & handover | IFC export, clash checks, trench quantities |
AI Copilot and Help & Guide sit at the right-hand end.
The interactive canvas. Click an element to select it, drag to move it, double-click a vertex to remove it. The drawing tools for every element type sit in a palette on the left edge of the map.
Controls sit in the corners: the basemap switcher (None / Streets / Satellite), a 3D toggle for terrain relief and building heights, 3D underground for the network at true depth, and Georeference for placing a model that has coordinates but no real-world position.
A Schematic view is available for models whose coordinates are diagrammatic rather than geographic.
Panels (right)
Section titled “Panels (right)”Three tabs:
- Properties - everything about the selected element, editable in place. For nodes this includes dry-weather flow, direct inflow and RDII; for conduits, geometry, roughness and head loss.
- Results - after a run, continuity and the run summary, the result tables, the design check, and exports.
- Map - thematic styling. Colour nodes and links by any attribute or result, choose the ramp and class count, and animate results through time.
With nothing selected, the Properties tab shows a model overview: element counts, layer visibility, and the validation list.
Flex Tables (bottom)
Section titled “Flex Tables (bottom)”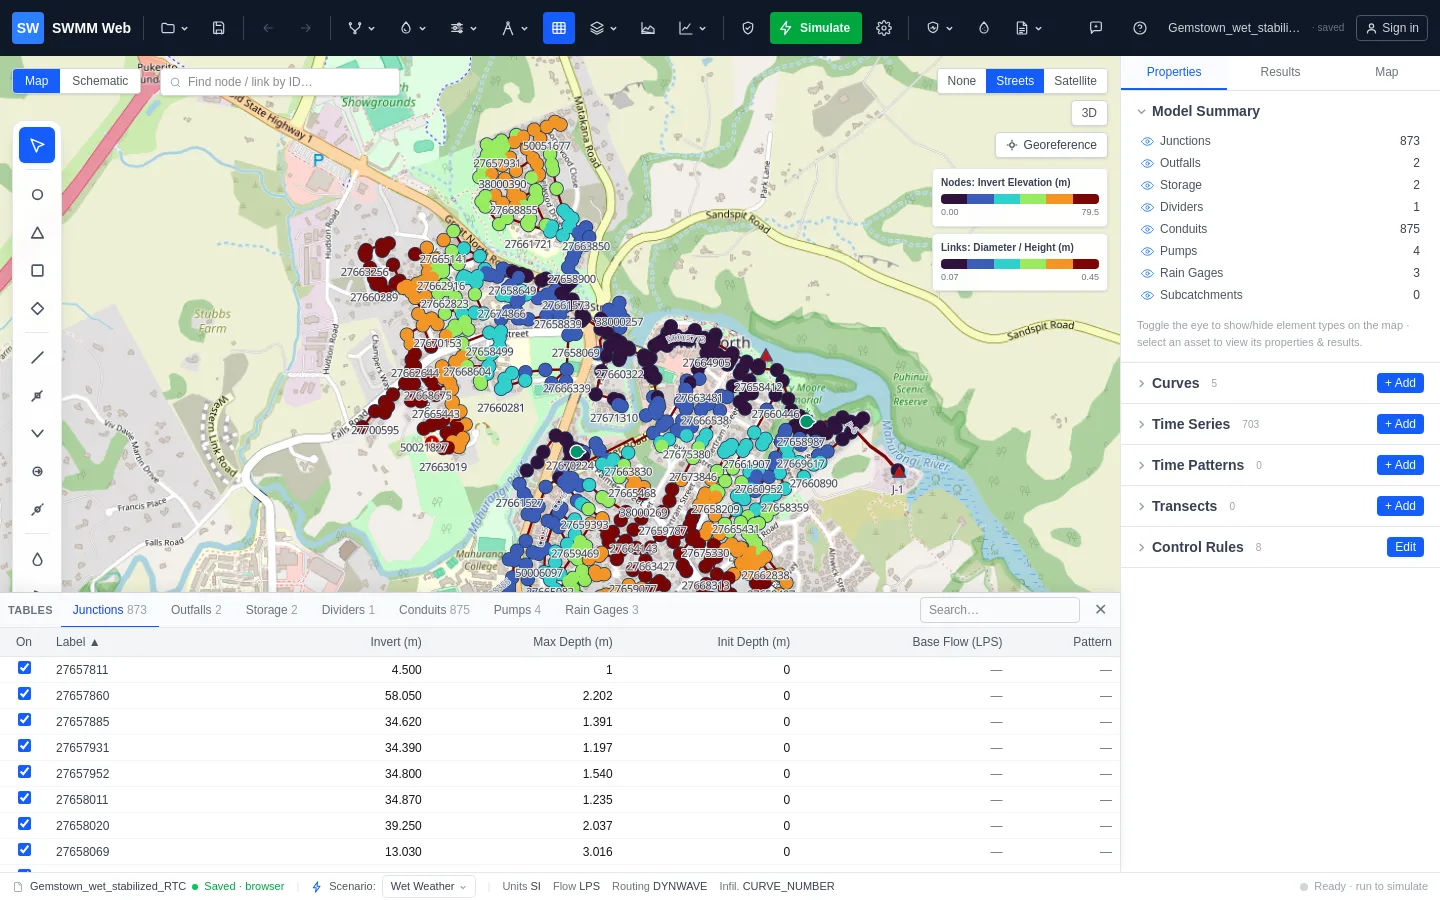
Every element type as a sortable, searchable grid - and the fastest way to review a model.
- Click a column header to sort.
- Click a row to select the element and fly the map to it.
- Double-click a cell to edit it.
- Untick On to exclude an element from the simulation without deleting it.
After a run, result columns appear: peak flow, velocity, depth, d/D and freeboard. Those
are read-only - they are outputs, not inputs - and they turn red at the thresholds that
mean failure.
Status bar
Section titled “Status bar”Along the bottom: the unit system in use, the active scenario, the current file and whether it has unsaved changes, and the state of the last run.
Getting help in context
Section titled “Getting help in context”Panels carry a ? button that opens the relevant help topic without losing your place, and the ? key opens the help panel from anywhere.