
Open the model
Worked example: Buzet
Buzet is a walled hilltop town in Istria, north-west Croatia - the “City of Truffles”, about 6,000 residents in the wider municipality. Its old town sits on a knoll; the modern town and its catchments spill down the surrounding hills toward the Mirna valley. Foul and storm water share one combined sewer that drains to a wastewater plant rated for 7,200 population-equivalent. That works in dry weather. In a storm, runoff from the hills pours into the same pipes the town’s sewage uses, the network surcharges, and manholes flood.
This example goes furthest of the set. Not is the model right (Warkworth) or what does it cost (Bello) or how good is the service (Lebanon), but the whole operational lifecycle: find the flooding, relieve it, cut the pollution it creates, and then run the network forward on live weather - forecasting the overflows, alerting on them, and printing the report the regulator asks for.
Download the file
What is in the model
Section titled “What is in the model”| Aspect | Detail |
|---|---|
| Network | 851 junctions, 851 conduits, 858 subcatchments, 6 outfalls |
| System | combined foul + storm; ~52 L/s dry-weather flow spread over every manhole |
| Origin | built from open map data with geo-to-model over the real Buzet street network |
| Forcing | a 41.5 mm design storm (24 h, 15-minute steps) on the single rain gage RG1 |
| Units | SI (LPS / hectares / mm); real geography, opens on the Streets basemap |
| Routing | dynamic wave, Horton infiltration; runs 01 Jan 2024 00:00 to 02 Jan 02:00 |
1. The problem: wet weather floods the network
Section titled “1. The problem: wet weather floods the network”The model as shipped already carries its relief (two CSOs - the next section), so it runs clean. To see the flooding the town started with, take that relief away for a moment:
-
From the Toolbar open Flex Tables, select Outfalls, and disable the two CSO outfalls
CSO_WestandCSO_East(untick them) - which takes their overflow weirsW_CSO_WestandW_CSO_Eastout with them. This returns the network to its pre-CSO state - everything has to squeeze through the pipes. -
Press the green Simulate button.
It solves cleanly - flow-routing continuity -0.04%, no errors - so what comes back is real hydraulics, not numerical noise:
- 23.9 ML floods out of the combined sewer over the storm, and
- six manholes surcharge and spill to the street -
N476,N492,N502,N503,MH78_C188andMH79_C188, on the two arms of the network that take the steepest hillside runoff.
Switch to the Map tab and colour nodes by Flooding to see them: two clusters, one on the western trunk below the old town, one on the eastern arm. This is the combined-sewer failure mode - the pipes are sized for foul flow plus a modest storm allowance, and the hills deliver far more than that.
2. The relief: two combined-sewer overflows
Section titled “2. The relief: two combined-sewer overflows”Re-tick the two CSO outfalls in Flex Tables and re-run. Flooding falls from 23.9 ML to 0.000 ML - the network is relieved. That relief is two combined-sewer overflows (CSOs), placed where the town’s own geography offered somewhere for the excess to go:
| CSO | Structure | Relieves | Discharges to |
|---|---|---|---|
| West | weir W_CSO_West at manhole N503 | the western trunk below the old town | the small stream immediately west |
| East | weir W_CSO_East at manhole MH78_C188 | the eastern hillside arm | the close stream to the east |
A CSO is not a valve you open - it is a weir with its crest set above the dry-weather water line. In dry weather the sewage flows under the crest and stays in the pipe, on its way to the plant. Only when a storm lifts the level above the crest does the excess spill over the weir to the stream. You can prove the crest is set right:
-
Select the rain gage
RG1and, for a dry test, point its Rainfall Source at a zero series (or just read the dry-weather hours of the storm run). -
Run and open the Spill register (below). In dry weather both new CSOs spill nothing - 0 L/s, 0 events. The foul water never reaches the crest.
In the design storm the two new CSOs carry the load the pipes could not: the western overflow spills
30,390 m³ to its stream, the eastern one 224 m³, and the pre-existing CSO1 a further
21 m³. Flooding is gone - but that water is now in the environment, which is the next problem.
3. The adaptation: cut the overflow at source with SUDS
Section titled “3. The adaptation: cut the overflow at source with SUDS”The CSOs trade a flooding problem for a pollution problem: 30 ML of diluted sewage now reaches the western stream in a single storm. End-of-pipe relief stops the flooding; it does not reduce the volume. Source control does. Buzet’s runoff comes off the hills, so slow it down where it lands.
Build a sustainable urban drainage (SUDS) scenario: add bio-retention to the hillside catchments
- rain gardens and bioswales that intercept a share of the roofs-and-roads runoff, store it in an engineered soil, and let it soak away or drain slowly instead of rushing to the combined sewer.
-
Select a hillside subcatchment, open the LID panel, and add a bio-retention control sized to a few percent of the lot area, set to capture part of its impervious runoff.
-
Repeat across the larger hill catchments (or apply it as a policy to all lots above a threshold), then save it as a scenario - “SUDS adaptation” - so you can compare it against the base network.
Applied to the 524 larger catchments (bio-retention on ~6 % of each lot, capturing 40 % of its impervious runoff), the model shows the value plainly:
- western CSO spill falls from 30.4 ML to 14.4 ML - a 53 % cut, and
- the small eastern and
CSO1spills disappear entirely, with flooding still at zero.
4. The operational digital twin
Section titled “4. The operational digital twin”A model that has been relieved and calibrated is worth more than a one-off study - it can be run forward on live weather and kept under watch. Buzet’s model does three operational jobs from the Operations & reports menu, and together they turn a hydraulic model into an operational and compliance tool.
4a. Forecast the overflows (weather to spill)
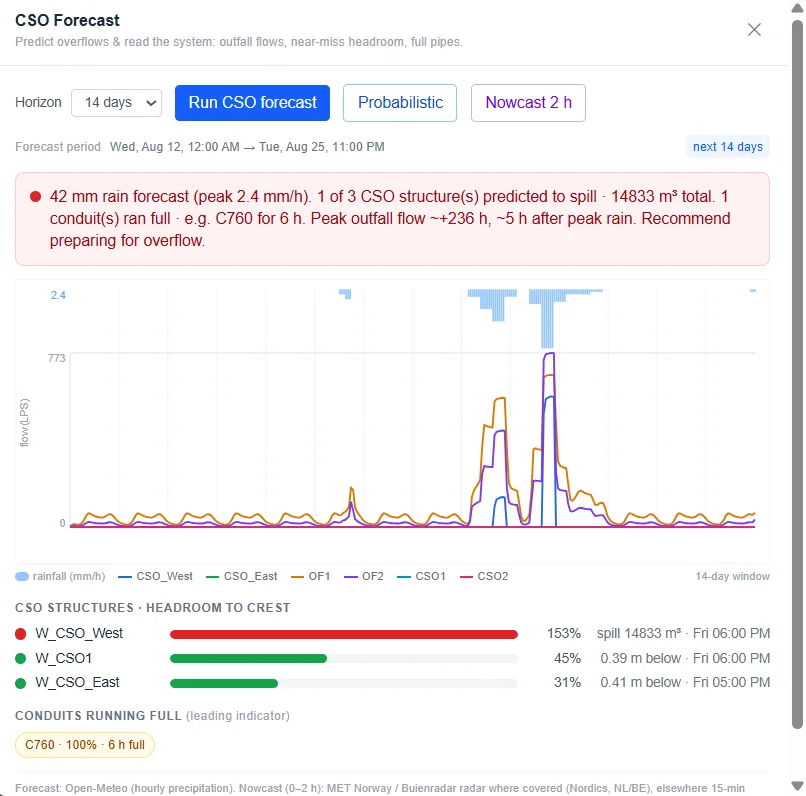
Section titled “4a. Forecast the overflows (weather to spill)”Open CSO forecast, choose the 14-day horizon, and Run. It fetches the real precipitation forecast for Buzet (Open-Meteo, with radar nowcasting for the first two hours), runs EPA SWMM over the whole horizon, and reports - per CSO structure - whether it will spill, when, how much, and how much headroom is left to its crest.
Over a dry stretch the answer is reassuring and specific: “No rainfall in the forecast window. No spill
predicted; CSO structures stayed well below crest. No action indicated.” The value shows the moment the
horizon catches weather. In the run below, a 42 mm band of rain (peak 2.4 mm/h) five days out pushes
the western CSO over its crest: the forecast predicts it will spill 14,833 m³, starting Friday around
18:00 - about five hours after the peak rain - while the other two structures stay below their crests
(W_CSO1 at 45 %, W_CSO_East at 31 %). It even names the pipe that fills first, C760, running full for
six hours, and recommends preparing for overflow. You are seeing the spill - with a time, a volume
and a place - days before it happens.
4b. Monitor and alert (the always-on forecast)
Section titled “4b. Monitor and alert (the always-on forecast)”The forecast is a button you press. CSO monitoring & alerts is the same run, scheduled. Create a
monitor - name it west_buzt_cso and point it at the western overflow, the one that does the work.
From then on a server re-runs the forecast on a schedule, and when a spill is predicted it emails an
alert to whoever is on call. It is the difference between checking the weather and being told when it
matters. (Monitoring runs on the server, so it needs a signed-in account on the Utility plan; the forecast
button runs in your browser on Pro.)
4c. The register and the regulator’s report
Section titled “4c. The register and the regulator’s report”Every run’s overflows land in the Spill register as dated events - which structure, when it started,
how long it ran, how much it discharged. For the design storm that is three lines: West 30,390 m³,
East 224 m³, CSO1 21 m³. One click turns the register into a regulator report (PDF) - the
spill summary an environmental agency asks a combined-sewer operator to file. The compliance paperwork
writes itself from the same model that predicted the spill.
What this example does not show
Section titled “What this example does not show”- A survey-grade network. It is built from open map data (geo-to-model) - a realistic system to reason about, not an as-built record. Inverts, diameters and the exact CSO locations are estimated.
- A site-specific storm. The 41.5 mm design storm is a representative wet day, not a Buzet DDF study
- plug in the local intensity-duration-frequency curve for a real assessment.
- Sized overflow structures. The CSO weir crests and cross-sections are design levers set to relieve the flooding in the model, not surveyed chamber dimensions.
- A calibrated forecast. The forecast and alerts read open weather through the model as a screen; compliance reporting should run on a calibrated model against gauged spills.
- Free compliance tooling. The forecast, monitoring, register and regulator report are the operations-and-compliance layer, on the Pro and Utility plans; opening, running and relieving the model is not gated.
- Worked example: Warkworth - is the model right? (calibration against SCADA)
- Worked example: Lebanon - grading a network’s level of service and restoring it
- Scenarios & planning - build the SUDS and climate scenarios yourself
- Reading results - the thematic map, profiles and flooding summary