
Thematic map styling
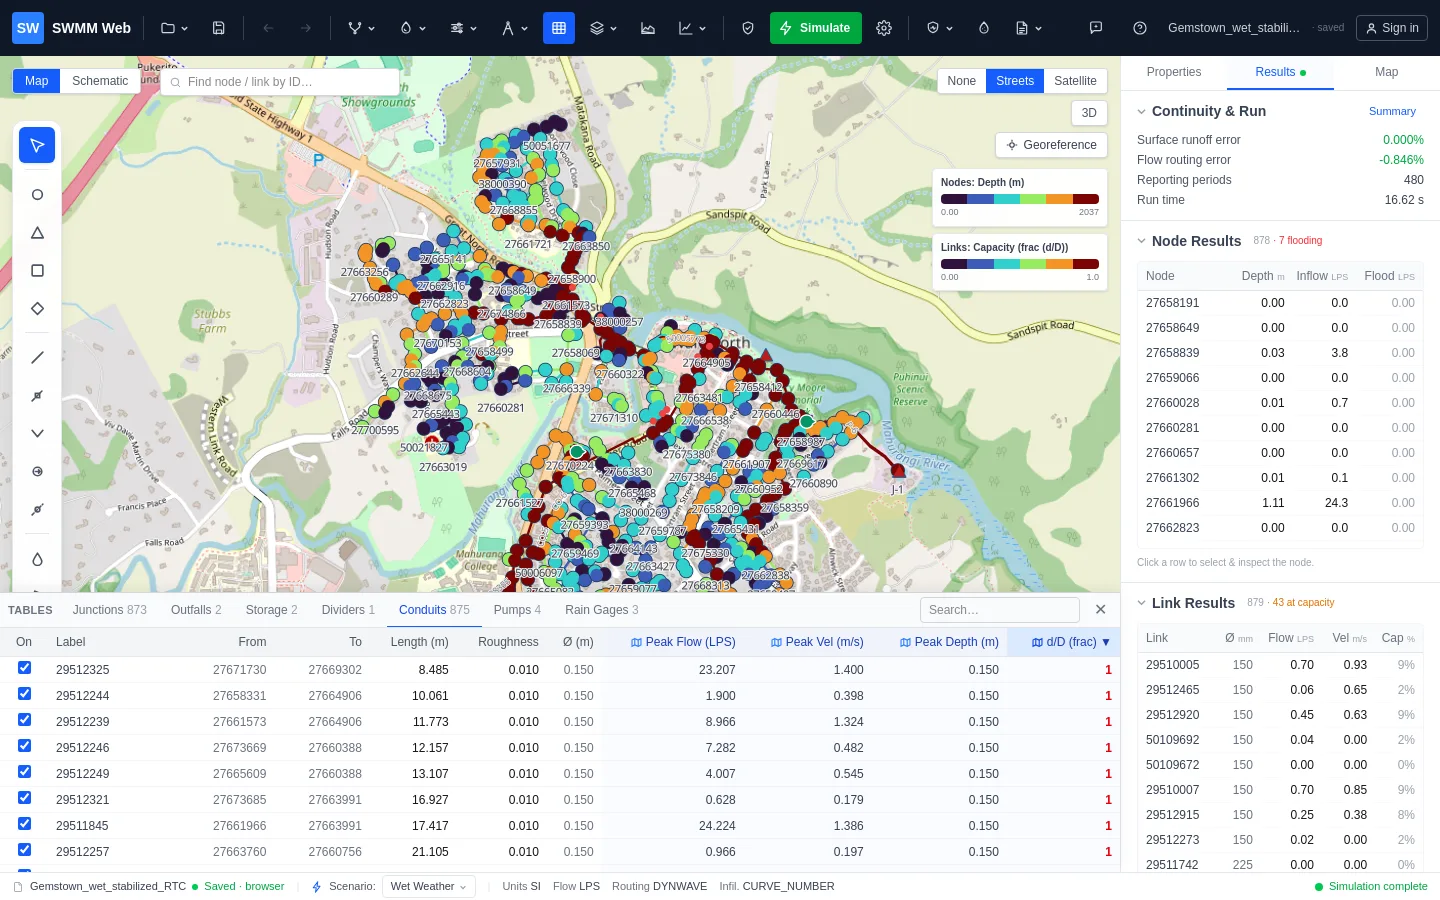
Thematic styling colours nodes and links by a value - an input property like diameter or
percentage impervious, or a result like depth, flow or d/D. It turns a network diagram into
a diagnostic.
Setting it up
Section titled “Setting it up”The Map tab in the right-hand panel carries the controls. Nodes and links are styled independently, each with its own attribute, colour ramp and class count, so you can shade links by capacity while shading nodes by flooding and read both at once.
Colours are classified rather than continuous: values are grouped into classes with a legend on the map, so a colour maps to a stated range instead of to a shade you have to estimate.
Animating a run
Section titled “Animating a run”After a simulation the player steps the styling through the run, so you can watch the storm arrive, the system fill, and the surcharge propagate.
What to shade, and when
Section titled “What to shade, and when”| Question | Shade links by | Shade nodes by |
|---|---|---|
| Where is it tight? | d/D (depth over diameter) | - |
| Where does it flood? | - | flooding rate, or depth |
| Is anything silting? | velocity (look for the low end) | - |
| Is the model sensible? | diameter, slope | invert, rim |
Shading by an input before you ever run is one of the better model checks: a diameter map that jumps from large to small and back again, or a slope map with isolated dark cells, shows data problems faster than reading a table.
d/D is the workhorse for capacity. Above 1.0 the pipe is surcharged; a long run of dark
links is a systemic capacity problem, while a single dark link between light ones is usually a
local constriction or a data error.