
Open the model
Worked example: Oldham & Royton
Oldham sits on the hills north-east of Manchester - a metropolitan borough of about 251,560 people draining into the tributaries of the River Irk and the River Medlock. Its combined sewers carry foul and storm water together, which is why, in heavy rain, the network has to shed its surplus through combined sewer overflows (CSOs) rather than flood the streets or drown the treatment works.
This example is different from the others. Not is the model right (Warkworth) or how do we smooth the pumps (Brăila), but the question a water company and its regulator actually argue about: when the network spills, how often, how dirty, and who is at risk? It walks the whole compliance loop the Environment Agency (EA) enforces - the spill register, the water-quality consent, the effect of climate change, and a first-pass flood-risk screen - on one real network.
Download the file
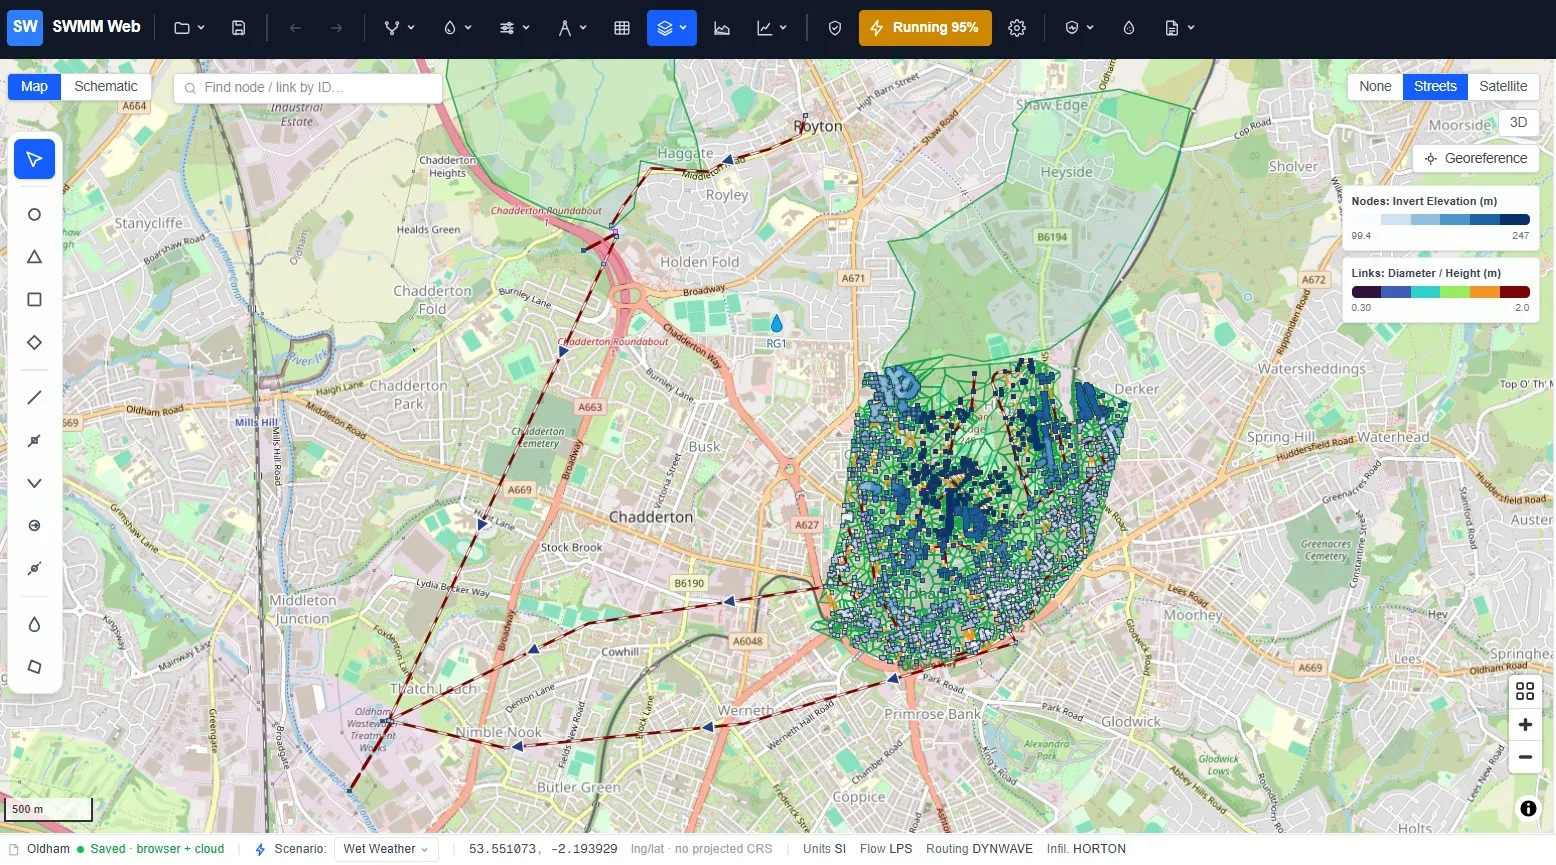
The scheme
Section titled “The scheme”The story turns on one asset. The old Royton Wastewater Treatment Works, about 4 km north of the main Oldham plant at Chadderton, was decommissioned as a treatment works and consolidated into Chadderton - but the site was kept as a strategic network node. Its reinforced-concrete tanks now serve as a 7,280 m³ storm-detention store, and the sequence in a storm is:
-
Collect. The Royton sub-catchment’s combined flow (city foul flow plus runoff) arrives at the site. In the model this is a 33 L/s dry-weather inflow plus the runoff from the upstream catchment.
-
Pass forward what treatment can take. A flow-to-full-treatment (FTFT) control capped at 325 L/s sends the maximum the works can properly treat down a 4.2 km, 600 mm gravity main to Chadderton (designed for a population equivalent of 157,000). In the model this is a throttle orifice holding ~319 L/s - the pipe never over-pressurises.
-
Buffer. Everything above 325 L/s backs up into the 7,280 m³ tank.
-
Spill, only if the tank fills. If the storm is severe or prolonged enough to fill the tank, a settled storm overflow vents the diluted surplus to a River Irk tributary - the Royton CSO.
-
Recover. After the storm the stored volume is pumped back to the inlet and sent down the 4.2 km main for treatment.
The model has two CSOs: CSO_WWTP_Royton (the tank overflow above) and CSO_WWTP_Oldham, which
relieves the trunk sewer near the main works when the system there is at capacity. Under a 2-year design
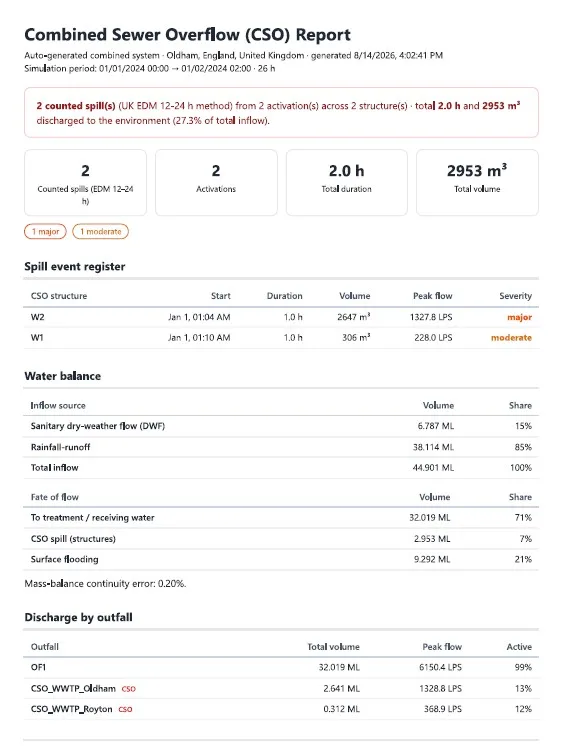
storm the corrected model runs cleanly (mass-balance continuity -0.02%), the FTFT holds at ~319 L/s,
and both CSOs activate: the Royton store discharges 0.31 ML, the Oldham overflow 2.64 ML, while
32 ML goes forward to treatment. Twenty-seven nodes surcharge - the combined network shedding its
surplus, which is exactly what the CSOs exist to relieve.
1 · The spill register (how the EA counts)
Section titled “1 · The spill register (how the EA counts)”A regulator does not care how many times a flow monitor twitched; it cares about the counted spills and their duration, recorded by Event Duration Monitoring (EDM). The UK method is block counting: an overflow that activates one or more times inside a 12-hour window counts as one spill; if it keeps spilling into the next window, that starts a new count. The app builds the register this way, so the number it reports is the one a permit is measured on.
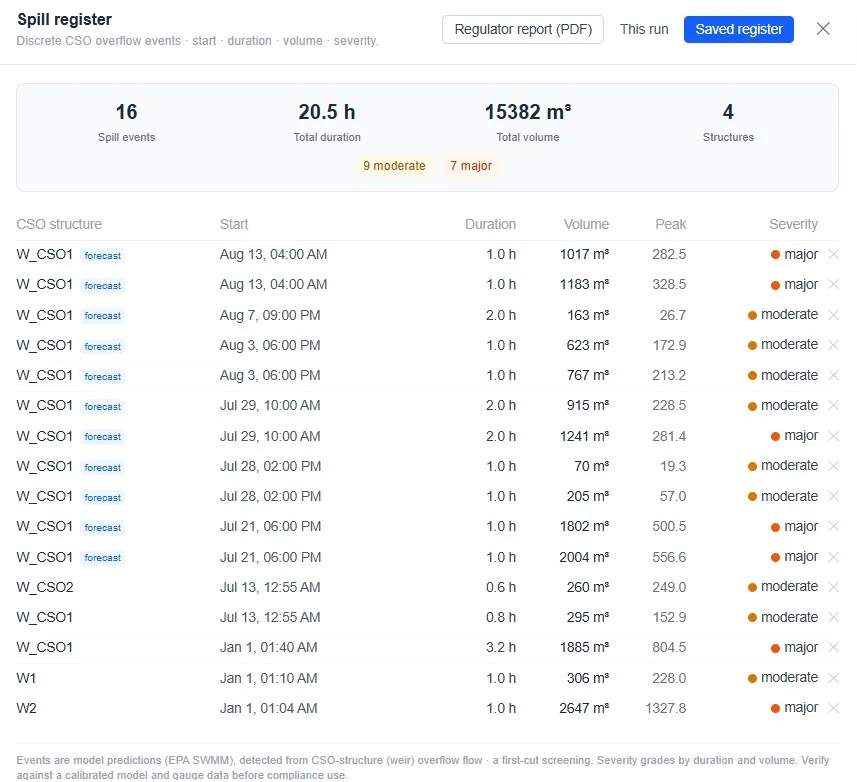
Over a long continuous run the register becomes an annual spill frequency per CSO, which the app bands against the EA’s Storm Overflow Assessment Framework (SOAF). The trigger everyone watches is more than 30 counted spills per year, the threshold for high-priority investigation. The Oldham & Royton Integrated Strategy (ORIS) - the storage and FTFT scheme this model represents - was designed precisely to keep these overflows out of the >30/yr band. The app flags each CSO’s band as green, amber or red so you can see at a glance whether the scheme still holds.
2 · Forecast and alert
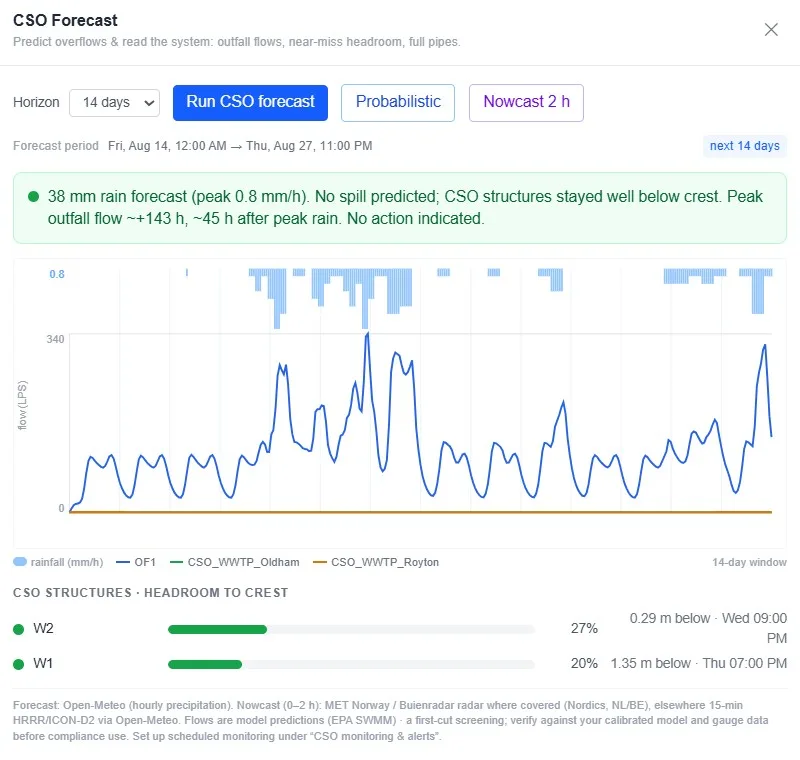
Section titled “2 · Forecast and alert”Compliance is not only retrospective. The same engine can run ahead of the weather: pull a rainfall forecast, run the network, and predict which CSO will spill, when, for how long, and how much - up to 14 days ahead. CSO monitoring & alerts emails or texts the operator before it happens, and produces the same spill register shown above.
3 · Water quality and the EA consent
Section titled “3 · Water quality and the EA consent”A CSO discharges diluted, untreated sewage, so the second thing the EA regulates is the pollutant load to the river. The water-quality model adds three determinands - BOD, ammonia and suspended solids (TSS) - with raw-sewage strengths on the dry-weather (foul) flow, so a spill carries a realistic sewage character rather than clean rainwater.
Under the ORIS upgrades the treated-effluent consents were tightened (the driver being the Freshwater Fish Directive / RE4 river standard):
| Determinand | Previous consent | Tightened consent |
|---|---|---|
| BOD | 15 mg/L | 6 mg/L |
| Ammonia (NH₃) | 2 mg/L | 1 mg/L |
Running the water-quality model on the design storm, the app reports the load and flow-weighted concentration at each discharge:
| Discharge | Volume | BOD | Ammonia | River class |
|---|---|---|---|---|
| CSO_WWTP_Royton | 0.31 ML | 2.5 kg · 8.2 mg/L | 0.14 kg · 0.45 mg/L | RE4 |
| CSO_WWTP_Oldham | 2.64 ML | 8.3 kg · 3.2 mg/L | 0.47 kg · 0.18 mg/L | RE2/3 |
| To treatment (FTFT) | 32 ML | 1,991 kg · 62 mg/L | 225 kg · 7 mg/L | (pre-treatment) |
Two things stand out. First, the scheme is doing its job: the concentrated foul load - nearly 2,000 kg of BOD - is kept in the treatment stream and sent to Chadderton, not to the river. Second, the CSO spills, though dilute, still exceed the 6 mg/L treated-effluent standard (the Royton overflow sits at RE4) - which is exactly why the EA caps how often they are allowed to happen. The consent is the yardstick the raw spill is measured against, not a limit the spill itself must meet.
4 · Climate resilience
Section titled “4 · Climate resilience”The 7,280 m³ tank nearly holds today’s design storm - which is what makes the scheme fragile under climate change. Apply a rainfall uplift (the app’s climate-resilience tools scale the design storm for a future horizon, UKCP-style) and the tank fills sooner and more often. The register shifts: more counted spills, more untreated load to the River Irk, and a real risk of Royton crossing the >30/yr SOAF band the scheme was built to stay under. The same model that tests compliance today is the one that sizes the next investment - how much extra storage keeps the overflow out of that band in 2050 or 2080.
5 · Flood-risk screen
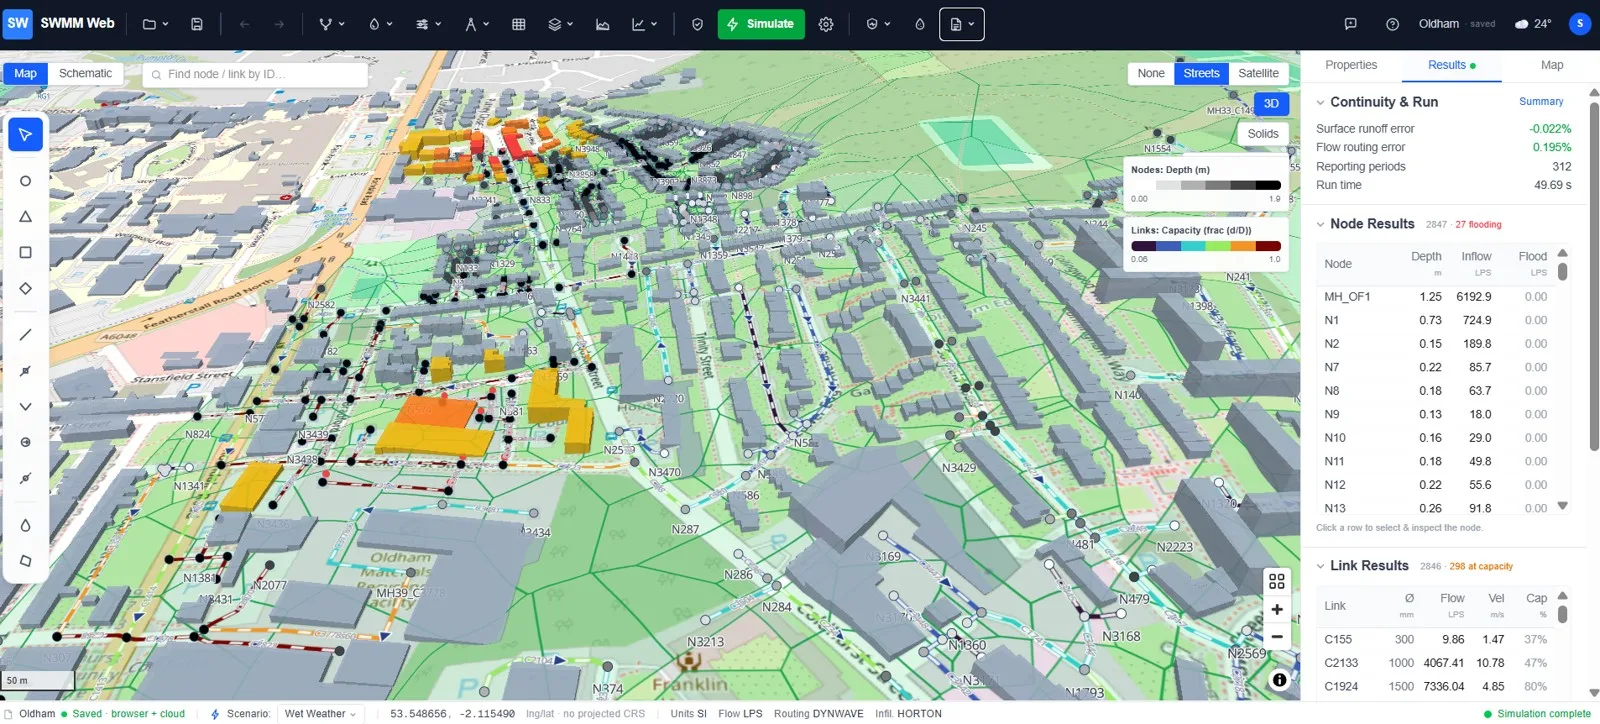
Section titled “5 · Flood-risk screen”Finally, where does the surplus that the CSOs don’t carry end up? Because the model was generated with an OSM building-footprint layer, the app’s Resilience & adaptation ▸ Flood-risk map (buildings)… gives a fast first-pass screen: it shades each building by its proximity to a flooded node (an influence radius you set, scaled by each node’s overflow rate), turning a list of flooded manholes into a map of which properties are exposed.
What the example shows
Section titled “What the example shows”On one real network, the app closes the loop a utility and its regulator work through: run the design storm, count the spills the way the EA counts them, quantify the pollutant load against the consent, stress-test it against climate change, and screen the buildings at risk - then forecast and alert before the next storm. The Royton store and its FTFT are the asset that keeps the foul load in treatment and the overflows (for now) out of the high-priority band.